Blog

Bonfire Dashboard: Strategic Advantage in One Screen

In God we trust. All others must bring data.

Last week, WPAi proudly announced the launch of Bonfire, our no-nonsense, seriously innovative data management platform. Bonfire is the backbone for a winning organization’s data management – allowing you to store, view, and explore your data right when you need it.

The Bonfire Dashboard is your home base within Bonfire. The insights gained from the Dashboard can make your queries smarter and faster when you work within your Arsenal. Dashboard transforms your data into three easy-to-read graphics: Turnout Likelihood, Top Scores, and Demographics.

So, the next time you have only five minutes before your weekly strategy call, Bonfire’s Dashboard is the quickest and most efficient way to conceptualize your data – all on your own, in real time.
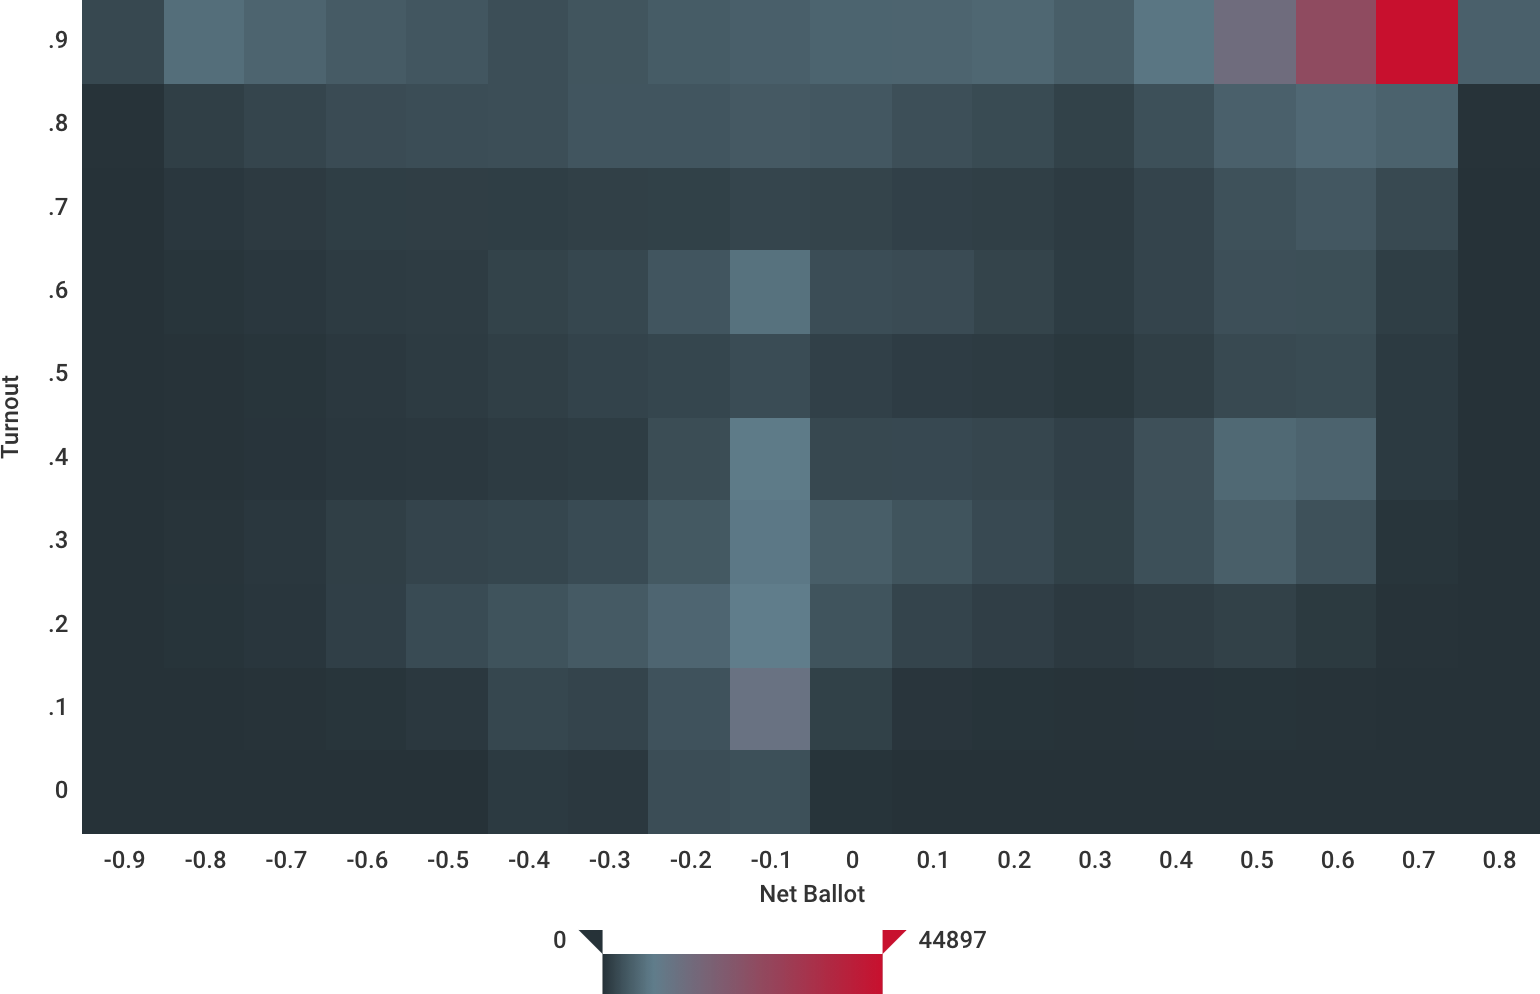

Turnout Likelihood

If you’re most interested in whether or how an individual is likely to vote, you can utilize the Turnout Likelihood section of your Dashboard. Here, you can instantly grasp the relative density of likely voters for targeting. Such as, should your next mail piece or digital ad be sent to a Persuadable Universe or a GOTV Universe? Or both?

PS: You can also do a quick estimate of universe sizes to explore at a greater depth in the Arsenal page.


Top Scores

But what should you talk to voters about? That’s where Top Scores come in.

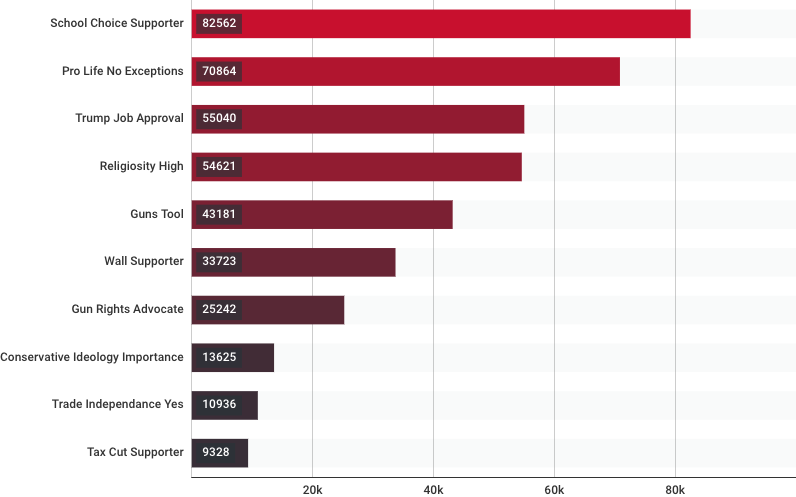
This list, for instance, allows us to see how many individuals in your region likely care more about school choice than all other issues.

Top Scores are pulled from our collection of national issue models, and they’ll help calibrate your messaging and serve as your go-to resource for the development of niche communications.


Demographics

Last, but certainly not least, the Demographics section takes a bird’s-eye view of your entire data segment.

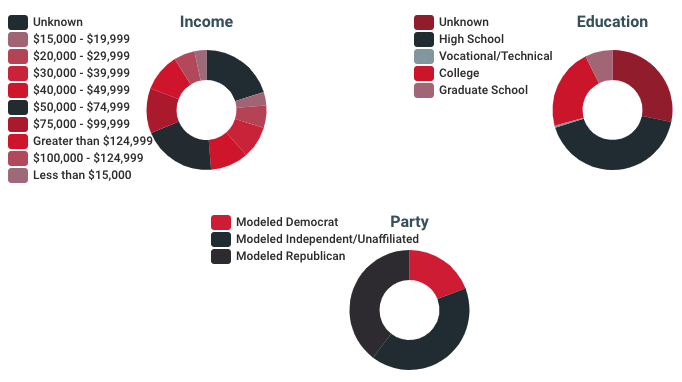
Pro tip: by hovering over any one bar you can see a count of any of the overall demographics in your region.

While much of Bonfire is dedicated to the granular details necessary for victory, Dashboard is the place where you can take a step back and look at the big picture. (Read: the quickest way to prep for your last-minute Zoom meeting.)

Next, we’ll look at the Arsenal – where specifics come to out to play.

IN THE MEANTIME, CLICK HERE TO LEARN MORE ABOUT BONFIRE OR TO GET STARTED.

###

WPA Intelligence Releases Bonfire

In God we trust. All others must bring data.

Data is complicated; we know. When your organization has hit the ground running and time is of the essence, you cannot afford to wait on anyone else. That’s why we created Bonfire.

Bonfire, WPAi’s no-nonsense, seriously innovative tool, is a data warehouse, visualization, and exploration platform. Bonfire will serve as the backbone for your data by integrating custom models, survey and consumer data, and all transactions in one easily accessible user interface.

Interactive features allow you to pull and manipulate data, see available segments, explore new models and segments from WPAi’s extensive, award-winning and industry-leading Data Dictionary, and export your data to use for custom audiences on your time.

In real time, you can download any of our three billion data points into your Arsenal using your credit card.

The data you need, right when you need it.

“It is more important than ever for organizations to quickly access their data in order to make real-time decisions, whether at 3 pm or 3 am. Powered by some of the most detailed and sophisticated voter modeling and audience-creation algorithms in the industry, Bonfire puts you in control, allowing you to update your data, enrich your intelligence, and make more effective decisions. Simply put, Bonfire delivers unrivaled intelligence that provides your cause or effort the edge it needs to succeed.” – Chris Wilson, CEO

TO LEARN MORE ABOUT BONFIRE, OR TO GET STARTED, CLICK HERE.

###

The Icosahedron #12 ft. Trevor Smith, Ph.D., and Chris Wilson on the Riots’ Impact on 2020

It seems many Democrat cheerleaders and candidates are finally realizing the dramatic impact the riots are having on 2020.

Don Lemon (8/25/2020): “The rioting has to stop. It’s showing up in the polling. It’s showing up in focus groups. It is the only thing right now that is sticking.

After George Floyd’s murder on May 25th, there was righteous anger across the political spectrum and not very many answers. The Left attributed the problem to systemic racism and many in both the middle and the Right agreed the problem must be addressed.

Witness the CNN poll (June 2–5, 2020) of adults released just two weeks after Floyd’s murder:

How big of a problem is racism in our society today? Is it a big problem, somewhat of a problem, a small problem, or not a problem at all?

Image for post

Very few Americans believed that racism wasn’t a problem at all when this poll was completed, even Republicans.

For context, in October of 2015, 49% of the country said racism was a big problem and in November 2011, 28% of the country said it was a big problem. In fact, 67% of the country saying racism is a big problem is the highest it has ever been on this measure.

To that end, a majority of the country (84%) and a majority of Republicans (79%) believed the peaceful protests were justified:

Image for post

What Americans did not justify, however, are the violent protests that occurred in this short timeframe after Floyd’s murder. Again, this poll was taken in early June and that is important context for this entire article.

Image for post

There was also strong favorable attitudes toward the Black Lives Matter (BLM) movement according to Quinnipiac (6/11–6/15) of the movement.

Image for post

Regardless, the issue of race and racism was brought to the forefront of minds across the United States, and positions on the matter generally swayed toward support and recognition of the issue.

So, what has happened since we came together as a country and recognized the problem?

Nationally, according to Civiqs, support for BLM is down four points since it reached its peak in early June. The reason for the drop can be found at looking at Independents and Republicans.

Image for post

Of course, nationally, the data do not matter, what matters is what’s happening in the states critical for the Electoral College and U.S. Senate.

The peak data represent when support for the Black Lives Matter movement was at its highest in each state and among Independents/Republicans.

What is clear is that opposition to BLM has more than doubled in its increase compared to the decrease in support. This increase in opposition is directly linked to the riots.

Image for post

A Heritage Action Battleground survey, which looked at Arizona, Florida, Pennsylvania, and Wisconsin, asked specifically about racial injustice versus violent protests. Sometimes, these questions can be positioned in such a way to get the desired result, but this time, the question inserts an equal amount of bias which is appropriate here:

Now thinking about the protests happening in many of our big cities, which of the following statements best represents your opinion.

These protests are a result of years of injustice and inequality suffered by Americans who are minorities as a result of systemic racism in our police departments and government in general.

…or…

These protests have stopped being about racial injustice and have become violent riots by people who hate America and want to tear down our government and radically change American culture.

In the four states a plurality of respondents (49%) chose the “violent riots” position while 42% chose the “racial injustice” position.

And, when breaking the responses down by state (n=400 per state), the results are very similar:

Image for post

The spread in Wisconsin is instructive as voters there were closest to the riots at the time of the study (and, of course, are now experiencing them).

To close, I want to acknowledge the brilliant mind of Dr. Charles Franklin of Marquette University in Wisconsin.

The shift in Wisconsin in just a few months has been remarkable. In the table below, the approval of Black Lives Matter protests is compared across two surveys he conducted. What he found is a drastic shift in approval overall (from +25 to 0), among Republicans (-24% to -62%), and Independents (+30% to +1%). Even among Democrats, the shift down in approval is notable as approval of the protests dropped nine points, while disapproval increased four points.

Image for post

So, will these riots have an impact on the election? Right now, the data are suggesting it will, as Independents have steadily moved away from supporting the movement.

I’ll leave you with a note that got a fellow political consultant from across the aisle, David Shor, fired for a simple statement of fact (how’s that for tolerance and respect for science???).

“Post-MLK-assassination race riots reduced Democratic vote share in surrounding counties by 2%, which was enough to tip the 1968 election to Nixon.” He was citing a perfectly rational study by Omar Wasow which can be found here.
Image for post

The violence we’ve seen since early summer is absolutely tipping the electoral scales toward Republican candidates. Democrats and their friends in the MSM fail to speak out on these riots (or worse, call them “peaceful protests”; see: Cillizza, Chris) at their own peril.

Researched and co-authored by Trevor Smith, PhD (@SmithWPAi) — Director of Research at WPA Intelligence
Co-authored and edited by Chris Wilson (@WilsonWPA) — CEO at WPA Intelligence

Looking for intelligence like this?

WPA Releases New Poll on 2024 General Election

The Icosahedron #11 ft. Trevor Smith, Ph.D., on National Data/Methodology

The meltdowns seen on Twitter over CNN’s August poll were pretty hilarious and the reassurances to trust the polling average from professionals even more so. But it is really strange to have such massive changes in results.

Biden leads this year, on CNN alone, are:

  • March: +10
  • April: +11
  • May: +5
  • June: +14
  • August: +4

So, naturally we’re curious. Besides the tired, old mistake of calling adults and screening down to registered voters, what in the world is going on here?

After looking at their crosstabs, the answer was pretty simple: CNN is having a horrible time controlling their Independents in the sample, likely due to screen down methods and buckshot sample framing.

At WPAi, we use the 2016 Presidential Vote to help control these types of inflections among Independents, but who knows what CNN uses… if anything at all.

What we do find very interesting is the 65+ portion of their samples as in every single poll since March but for June, Biden has led by double-digits. Let us reiterate this point again: voters aged 65+ are not a monolith and while they have been friendly to Republicans over the past decade, they have been hit very hard by the pandemic and the economy.

The Democrats are seeing this in their numbers and are using the blatant lie about Social Security checks going out through the mail (President Obama ended this practice) to enhance this whole USPS issue that is occurring. Be that as it may, again, in your campaigns you need to identify how to shore up and, in many cases, bring these voters back.

Enthusiasm (pre-Harris VP choice)

We wanted to update our enthusiasm measure to capture any pre-Harris enthusiasm that might exist. As we did a few weeks ago, we’re looking at the net enthusiasm both overall and two specific groups of voters using all Economist/YouGov polls since June .


President Trump Enthusiasm

  • Enthusiasm for President Trump overall has increased a bit since June, 1%.
  • Overall, people are slightly more upset since June (45 to 46%), but overall enthusiasm for his campaign has increased 2%
  • Both Trump and Biden voters’ enthusiasm for Trump has remained relatively the same: 0% change in net enthusiasm among Trump voters and <1% change in net enthusiasm among Biden voters.

Image for post

Biden Enthusiasm

  • Biden, on the other hand, has increased his net enthusiasm 23% among his current voters.
  • At this same time, Trump voters are starting to solidify against Biden with a net negative change of 11%.

Image for post

Moving closer to the election might be naturally producing these results, but we’ll be curious to see in the next couple of polls if the Harris VP nod has any effect on enthusiasm.

Looking for intelligence like this?

WPA Releases New Poll on 2024 General Election

What’s Next! Virginia – Published 08/12/2020

[imge_pdf_viewer url=http://wpaintel.com/wp-content/uploads/2020/08/WhatsNextVirginia_200812.pdf]

The Icosahedron #10 ft. Matt Knee on the Vote-by-Mail Surge & Predicting the Unpredictable

The traditional method for modeling voter turnout is looking at historical voting patterns, supplemented with enthusiasm measures. When election rules or voting dynamics change, however, information on who voted in the past becomes a lot less useful. To ensure quality turnout models for our clients, we have analyzed this year’s primary elections in which voting rules changed; this has allowed us to apply those patterns and lessons to future turnout models.

While adjusting turnout of occasional voters for a more enthusiastic electorate is rather straightforward, the main challenge comes from voters who are voting in primaries for the first time. While some of these voters are just young people getting in the habit of voting, many are not, and are instead general election voters newly voting in primaries or are new to voting altogether.

Between white-hot political enthusiasm, the effects of COVID-19, and some jurisdictions mailing absentee ballot requests (or actual ballots) to every voter – or otherwise increasing convenience voting – there is a lot to sort out.

The sending of absentee ballot requests or ballots to every voter is especially disruptive. We analyzed the vote history available for the Georgia primary election data as part of our efforts to update our turnout modeling process.

Here are some of our findings and solutions.

Findings

  1. In 2016, 20,103 mail-in votes were cast in Georgia, where or 3.5% of the total vote. In 2020, 485,894 mail-in votes were cast, or 49% of the total vote.
  2. 69% of primary voters were first-time primary voters. In 2016, it was 17%.
  3. While 55% of new primary voters had voted in general elections, 45% were entirely new.
  4. 32% of new voters in the 2020 primary were under 45. Only 12% of overall voters were. However, there were also plenty of older new voters: 32% were 65 or older.
  5. While Georgia does not have party registration, our party models suggest these new voters were disproportionately Democratic.

Solutions

  1. We built models of new voters in Georgia to adjust turnout in other areas that specifically mailed absentee requests to their voters. By examining the patterns of what type of voter is likely to begin voting when offered an absentee ballot, we can apply this to other areas that have made this offer.
  2. We built new voter models based on historical and 2020 new voters, so as to adjust new voters independent of rules changes.
  3. By combining historical models, rule-change models, new voter models, enthusiasm models, and political judgement, we can better predict voter turnout in these unprecedented times. So far, we have deployed these methods in Oklahoma and Alabama primary races, and accurately predicted turnout within a percentage point each time.
  4. We will continue to build models, as data becomes available, to find and apply the patterns and effects of voting rule changes.

If you’re interested in what turnout looks like in your district, contact us.

WPA Releases New Poll on 2024 General Election

The Icosahedron #9 ft. Trevor Smith, Ph.D. on National Data Trends

Thanks for reading our newsletter! In this issue, Research Director Trevor Smith, Ph.D., provides insight on the latest national data, and how we’re helping our clients navigate the climate. For intelligence like this and more, contact us and we’ll connect you with a member of our team.

A PSA on National Data Trends

By Trevor Smith, Ph.D., Research Director

Over the past few weeks, we’ve been analyzing various polls to provide the best insight possible overall and among key demographic groups (consider this your pocket-sized meta-analysis of national polling).

This report has two sections: 1) Key Groups & Breaks to Watch and 2) Coronavirus.

Key Groups & Breaks to Watch (Rolling Together June 25-July 7 National Polls)

Seniors (65+): In the past six elections, these voters favored the GOP, from +2 in 2018 to +8 in 2008. The last time we ran even among seniors was in 2006.  


In the latest average, Republicans are near even with Democrats. This is a great concern at the moment and the GOP must figure out a way to be less like 2018 and more like 2016 with this group of voters.

Ignoring the current average, we think there is a mode effect happening between the Economist/YouGov polls (all online panel) versus everyone else.

On the Generic Congressional Ballot:

  • Economist/YouGov – 16 polls since mid-March, GOP 50% and DEM 43%
  • All Else – four polls since mid-March, GOP 43% and DEM 51%

There is clearly a disparity in the number of live versus online polls, but the difference is interesting and something we are watching.  

White Voters Overall: In the 2016 election, President Trump won Whites by 20% and in 2018, Republicans won Whites by 10%. The data currently suggest Republicans are currently behind on the ballot compared to these markers.

Generic Congressional Ballot: +6%
Presidential Ballot: +6%

White Voters Broken Out by Education: White voters are not a monolith. One significant break within white voters is that of Whites without a college degree versus those with a college degree. In 2016, President Trump won Whites without a college degree 66% to 29% and Whites with a college degree 48% to 45%. 

In the most recent average
: 

  • No College Degree  GOP is +21 on the Generic Congressional Ballot  
  • College Degree – GOP is -23% on the Generic Congressional Ballot 

We are watching these two groups of voters and identifying how our clients can widen our lead among those without a college degree and decrease our current disadvantage among those Whites with a degree.

The WPAi Solution

Republicans need to find out which messages bring these different subgroups of voters back into the fold. Typical polling lets you look at the cross tabs and figure out which messages voters say moves them.

But WPAi’s Message MapTM methodology allows our clients to dig deeper and find out which messages actually move different groups of voters. Not only that, our Message Maps help clarify which messages will cut through the noise of a busy campaign and news cycle – vital intelligence for any candidate or group looking to make meaningful impact in a race.

Coronavirus

According to Civiqs, concern about the Coronavirus appears to have leveled off around 62% throughout July but, more importantly, every single national demo shows roughly equal concerns (between 55% for Whites to as high as 88% for Democrats and Blacks) except for Republicans (33%). This lack of concern among Republicans compared to other parties is consistent across almost all states.

Overall Concern, Nationally 


Additionallythis Republican split is also evident when it comes to satisfaction of the federal government’s response to the pandemic: Republicans are 72% satisfied, Democrats 5%, and Independents 35%.

Voters 65+ are the most satisfied (44%) compared to other age breaks: 50-64 (41%), 35-49 (33%), and 18-34 (22%). The combination of high levels of concern and satisfaction with the federal government’s response among 65+ could be an opportunity to consolidate support amongst seniors alongside more typical campaign messaging. 


Satisfaction with Federal Government Response

There are currently two Americas when it comes to issues around the Coronavirus: Republicans, and everyone else. Moving forward, it will be important to see how Independents continue to respond to various events regarding the Coronavirus.

The WPAi Solution
We are finding that a message hitting Democrats on China stealing intellectual property and technology from American Companies and covering up the COVID-19 pandemic, delaying worldwide response, is having the intended effect of moving voters toward our ticket. China is increasingly viewed negatively by members of both parties (Pew Research), and given the Chinese Communist Party’s cover-up of the virus in the early months, Republicans can highlight how China has been, and will continue to be, held accountable. 

Therefore, we have developed a model of voters who are most likely to blame China for the pandemic and want to hold the country responsible. These voters will be most receptive to campaign messaging that blames China and will want a leader to hold the CCP accountable. This universe is available nationwide and can be overlaid with any custom or Data Dictionary models available on our website.

Ready to get started?

Oops! We could not locate your form.


Five Things Republican Women Candidates Should Know

You should know that…


…it’s less of an exclusive club (which is a *very* good thing). There are more Republican women running for Congress than ever before. 224 women have stepped up to run. This number is a huge win for the NRCC, its Recruitment Chair Susan Brooks, Rep. Elise Stefanik, and outside groups like Winning For Women (WFW) and VIEW PAC.

…there is more support for you than ever before. Republican groups have really stepped up for Republican women during this primary season. VIEW PAC and Stefanik’s E-PAC have been helping women candidates raise the hard dollars they need for their campaigns and WFW’s Super PAC uses Independent Expenditures in support of their endorsed candidates.

…you need to emphasize your grit to Republican voters. Primaries are often the toughest hurdle for Republican women to clear. Fundraising is tougher because donors wait to see who emerges, and voters can often perceive women candidates as too moderate. How do you overcome that? First, target your messages on the issues to those who care about those positions (check out our Data Dictionary options for this). Then, show your authentic grit. Primary voters often want to see someone with the toughness to stand up to the Left. Tell voters where you stand on the issues and, importantly, tell them why you care and why you won’t back down from your position.

…your gender can be a tool to use to connect with voters, including in primaries. Republicans are not known for buying into the Left’s concept of identity politics, but there are voters (men and women) who believe the world would be better off if more women were in charge. In general elections, more voters see women candidates as outsiders and agents of change. In primaries, this is a niche message that needs to be expertly targeted. That’s where we come in (check out how our digital team is changing the game).

…we’re here to help. WPAi’s Cleopatra model identifies the voters who most believe that women can and should be running things. Restricted to primary voters or opened to include general election voters, Republican women candidates and their campaigns can use their gender as a tool to connect with these individual voters. This model is as close to turn-key ready as you can get: You have a clear, authentic, easy to execute message that will resonate with a targetable group of voters. Reach out today to learn more!


Oops! We could not locate your form.

Five Things to Know About Independent Voters

[imge_pdf_viewer url=http://wpaintel.com/wp-content/uploads/2020/06/IndependentVoters_AI_200625.pdf]

Senior Strategist Conor Maguire Introduces COVID-19 Data Segments