Blog

The Icosahedron #3 ft. Amanda Iovino and Conor Maguire — Published 12/10/2019

Thanks for reading our newsletter. This issue features timely pieces from two of our Senior Strategists at WPA Intelligence. Conor Maguire outlines how impeaching President Trump is set to boomerang on Democrats, particularly in the House districts they won in 2018. Amanda Iovino takes a look at health care and suburban women, the issue that fueled the 2018 takeover in terms of costs, not coverage.

Michael D. Cohen, Ph.D., CSO, WPA Intelligence

                                                             Estimated read time: 10 minutes

Impeachment is a Gift

By Conor Maguire, Senior Strategist

It has been 1,127 days since Donald Trump was elected by the people as the 45th President of the United States of America… and Democrats still can’t believe it. Over the last three years, one month, and two days, Democrats have done nothing but fight this fact by doing everything to resist President Trump, continuously attacking his legitimacy and support of our county. Well, with the number of failed attacks on President Trump growing almost as fast as the economy, the chickens may be coming home to roost.

At WPAi, we are very focused on the 31 House Democrats sitting in districts that Trump carried in 2016, and they are poised to be the collateral damage of a near-sighted Democrat Party.

The Democrats’ push for impeachment promised bombshell interviews, facts beyond reasonable doubt, and a clear chain of evidence pointing directly to the self-serving misconduct by the President of the United States. But after all of the hearings, what’s left is nothing of the sort. It turns out that boring, convoluted, and partisan hearings on the extremely esoteric topic of geopolitics is not a way to win over voters and the proof is in the pudding.

Support for an impeachment inquiry peaked in early October, with 52% overall, according to the aggregation of public polls on Real Clear Politics. Today, support for impeachment is down to 48% and the difference with those who oppose is narrowing. Even more interesting is what’s going on with Independents. At the end of October, one outlier poll from IBD/TIPP had support for impeachment at 64%. Today, the RCP average has it at 45%, under the overall average by three points. Bottom line, after all of the hearings, a majority of the American people do not support impeaching President Trump.
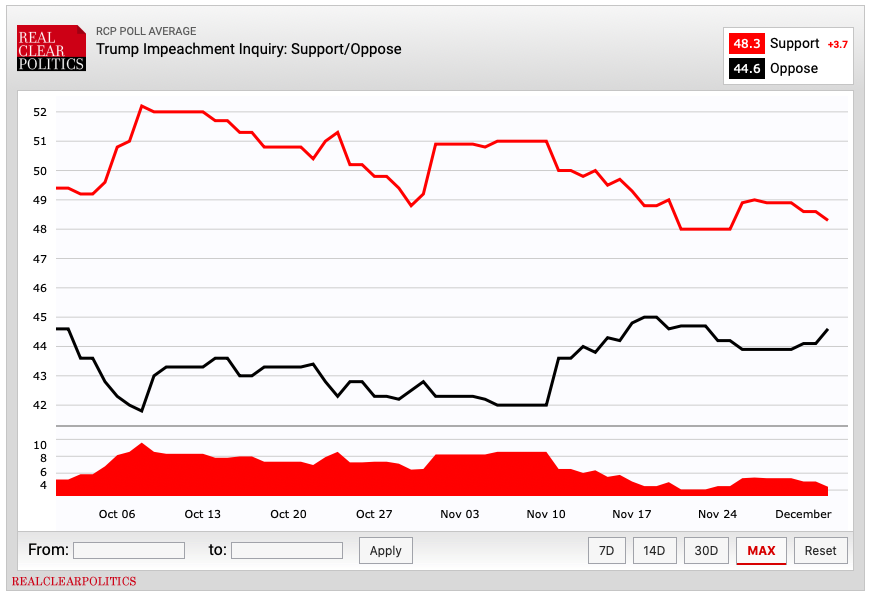

Credit: Real Clear Politics

Let’s look at those who will have to take the vote soon. Many 2018 House races (especially in Trump 2016 districts) were won by tiny margins among relatively small numbers of persuadable voters. Newly elected House members who won in a Trump district – including Ben McAdams (UT-04), Mikie Sherrill (NJ-11), Anthony Brindisi (NY-22), and Kendra Horn (OK-05) – are all targets in non-Presidential states, but could feel the blowback from a myopic, politically driven Democrat impeachment push. Trump won the Brindisi seat by 15%, Horn’s by 13%, and McAdams by seven percent. While Trump won Sherrill’s by only one percent, she was lambasted by her constituents in a town hall over the Thanksgiving break, as reported by Politico. The message: vote for impeachment at your peril.

Republicans running in similar districts can hold their Democrat opponent’s feet to the fire no matter how it turns out. With extremely important projects and agreements, like USMCA, being held up by continued attacks on the President, data shows that constituents are open to switch back to voting for Republicans. Even the New York Times highlights this in a recent article where polling indicates that two-thirds of battleground state voters who voted for Trump in 2016, then a Democrat for House in 2018, will be once again be voting for Donald Trump. Voters want to their government to accomplish the basic job it is hired to do, and Republicans should remind voters of this throughout the next year. A Christmas impeachment may end up being a gift… for President Trump and the GOP.

Swing Women – Still Swinging: Health Care Costs

By Amanda Iovino, Senior Client Strategist

While the media blames President Trump, swing women have been a voting bloc equal parts vital and confusing for Republican campaigns for years.

Women voters in the suburbs are concerned about the President and the tone of his Twitter account, but they are also concerned about the same policy issues that campaigns have been talking about for decades. What has happened over the last few election cycles is that, while Republican messaging has stayed roughly the same, the way swing women have been thinking about these issues has changed.

Pocketbook Issues used to mean taxes. “Getting to keep more of your money in your own pocket” has been (and remains) a solid talking point for Republican candidates. However, over the last several years, Republicans – especially in the states – have done such a good job lowering taxes and fees that the issue is not as top-of-mind to voters as it was in 2010.

Instead, health care costs are the main drain on voters’ pocketbooks. Premiums, deductibles, co-pays, and prescription drug costs all eat away at any marginal increase in a family’s budget.

Tax cut savings? Went to pay their deductible when their kid broke his leg. Wage gains thanks to a growing economy? Those have been countered by higher premium costs being deducted from their paychecks.

Earlier this fall, 77% of women told National Geographic/Ipsos that health care costs were a “big problem” in society with another 18% calling costs a “moderate problem” making it the top issue among all women across the country.


Credit: National Geographic/Ipsos

Republicans cannot afford to not talk about health care this cycle, and neither can swing women. They are at a financial breaking point. Not talking about health care as a pocketbook issue is undercutting Republicans’ economic messaging more broadly and makes us appear out of touch with the day-to-day lives of voters.

But knowing how to talk with swing women about health care costs in an authentic and resonant way requires putting data behind the messaging. Using our decades of polling expertise and signature MessageMap technology, WPAi can help develop the messages that will move swing voters back to the Right.

If you are interested in receiving our bi-weekly newsletter, click here.

The Icosahedron #2 ft. Chris Wilson and Michael Cohen, Ph.D. — Published 11/29/2019

Thank you for reading our newsletter. This issue features two counter-narrative pieces: an excerpt of CEO Chris Wilson’s Washington Post op-ed, defending digital microtargeted political advertising and mine showing how Republicans can hold onto the suburbs everyone is telling us we’re losing. – Michael D. Cohen, Ph.D., CSO, WPA Intelligence

Getting Rid of Microtargeting in Political Advertising is a Terrible Idea

By Chris Wilson, CEO

Jack Dorsey, chief executive of Twitter, unleashed a frenzy of commentary when he went Pontius Pilate and effectively washed his hands of the false advertising problem online by announcing his platform would no longer take political ads. But perhaps the most alarming reaction came from Federal Election Commission Chair Ellen Weintraub, who called on social media giants to “stop the practice of microtargeting” ads on their platforms.

As someone who has worked on multiple state and federal election campaigns, I found such comments from the highest campaign regulatory official in the country counterproductive and anti-democratic. Such a radical proposal would limit speech, reward millionaire candidates, protect incumbents and, worst of all, limit the newfound interest and participation in U.S. elections.

Since the adoption of individualized campaign analytics, turnout has skyrocketed. 2016 saw a 6 percent bump in turnout from 2012 — an increase of more than 8 million voters. In the 2018 midterms, 35 million more voters participated than in the 2014 midterms, and 27 million more voters than in 2010 (despite the tea party wave that year).

Unlike typical wave elections, in which one side is motivated and the other side depressed, campaigns from both parties have increased interest through direct, data-driven appeals that spoke directly to each voter. More reluctant voters, previously ignored by most campaigns, are now included in digital advertising that address them directly. Developing new ways to convince people that voting is worthwhile is the primary task of campaign sciences.

To read the full piece, click here.

Socialism in the Suburbs?

By Michael Cohen, Ph.D., Chief Strategy Officer

The narrative coming out of the off-year election is reinforcing the conventional wisdom that Trump is doomed in the suburbs. But elections are choices, so let’s play out a thought experiment based on current information. As Biden fades and many older black primary voters fail to embrace Mayor Pete, what if the Democrats nominate Iowa front-runner Elizabeth Warren, who is campaigning via hashtags on Bernie’s socialist platform, which includes #M4A, #GND, #FreeCollege, and #TwoCents? Who do these suburban voters choose in next year’s general election: someone who has cut taxes or someone who’d raise them?

Public polling released this week by none other than the New York Times (and Siena) suggests that Trump has a shot, if not the inside track, on holding the six battleground states that he won in 2016: AZ, FL, MI, NC, PA, WI. The interesting thing about this poll is that they, at least, attempted to balance the electorate to include non-college educated likely voters, which favor Trump. The baseline suggests that we haven’t moved very far, which means Trump doesn’t have to win the suburbs, or regain what Republicans lost, just narrow the spread. Oh, and Warren doesn’t win any of battlegrounds (as of today).

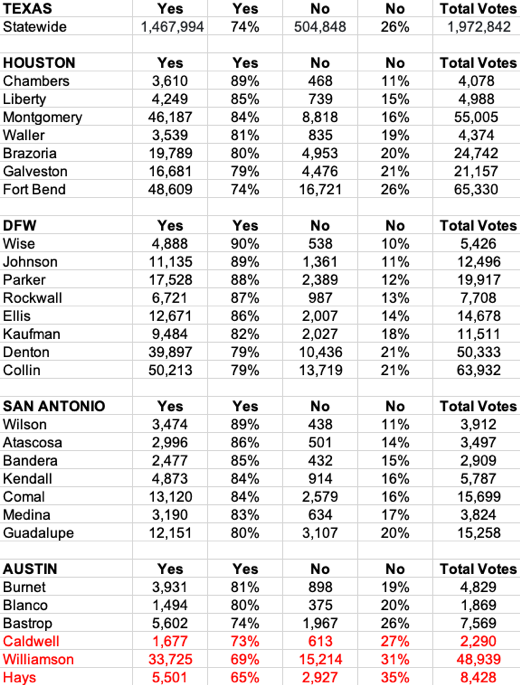
The cost of socialism apparently doesn’t play well in the suburbs. A couple of cents from “billionaires” won’t be able to fund the #WarrenWishList and, as it turns out, suburban voters would rather keep their hard-earned money. An example from the most recent election would be suburban Texas; while we are told that they are trending blue (not enough for Beto, of course), voters chose to ban a state income tax, and inner-ring suburban voters, were even more likely to do so.

Campaigns are not won in the abstract; generic or uncontested potential nominees haven’t faced the test of a national election. Candidates who were predicted to lose sometimes win because the right team identifies the right voters at the right time with the right message, as we do for our clients.

Should Elizabeth Warren find herself in a debate with President Trump, she’ll be confronted with the question: billionaires cannot pay for all of this so how much will suburban voters have to pay? She won’t have a plan for that question, but Trump will.

If you are interested in receiving our bi-weekly newsletter, click here.
What Every Campaign Manager Needs To Know About Political Modeling | Part 2

[imge_pdf_viewer url=http://wpaintel.com/wp-content/uploads/2019/05/What-Every-Campaign-Manager-Needs-To-Know-About-Political-Modeling-Pt.-2-5-1.pdf]

What Every Campaign Manager Needs To Know About Political Modeling | Part 1

[imge_pdf_viewer url=http://wpaintel.com/wp-content/uploads/2019/04/What-Every-Campaign-Manager-Needs-To-Know-About-Political-Modeling-Pt.-1.pdf]

March Madness 2020 Democrats Edition

[imge_pdf_viewer url=http://wpaintel.com/wp-content/uploads/2019/03/MARCH-MADNESS-2.pdf]

WPA Announces Hiring of Hilary Bombard Resta

WASHINGTON—WPA Intelligence, a leading conservative polling and data analytics firm announces the hiring of Hilary Bombard Resta to head the firm’s digital department.

Hilary brings years of digital experience and expertise as well as political acumen to the team. Before joining WPAi, she served as Deputy Digital Director for Texans for Greg Abbott. Resta oversaw an ad budget of $12 million, as well as content creation and campaign messaging.

Prior to joining Abbott’s team, she worked for leading digital firm Targeted Victory where she managed the strategic online advertising and communications plans for multiple statewide initiatives and Gubernatorial campaigns. Resta also served as the Email Marketing Manager for Mitt Romney’s presidential race in 2012.

Resta’s position expands WPAi’s suite of services, providing clients with a comprehensive solution that pairs expert opinion research and data analytics with digital strategy and execution.

As Senior Digital Strategist, Resta will lead the firm’s digital department by integrating the digital implementation of WPAi’s data into client strategy. This growth allows WPAi to offer an end-to-end solution to their clients by driving outcomes with the right messages, identifying the right audiences, and helping campaigns and existing digital vendors deliver highly targeted digital advertising using an integrated, complete solution consisting of opinion research and data analytics.

“Our digital strategy and advertising practice will leverage WPAi’s sophisticated audiences and messaging into highly targeted digital advertising campaigns,” said WPA CEO Chris Wilson. “With WPAi, the whole is greater than the sum of its parts. While there are firms that specialize in opinion research, data analytics, or digital strategy, there are few other firms in Republican politics that can offer all three under one roof.”

About WPAi

Since 1998, WPA Intelligence has been a leading provider of survey research, predictive analytics and technology for corporations, educational institutions, public affairs programs, non-profits and campaigns from President to Governor, U.S. Senate, and local elections in all 50 states and multiple foreign countries.  In the 2017-2018 cycle, WPAi’s polling and data plotted the course for multiple winning Senate, Governor’s races and House campaigns.

WPAi’s data and analytics continue to lead the industry. In the 2016 Republican primary for president, arguably the most unprecedented presidential contest by way of turnout and political environment volatility, WPAi accurately projected turnout and the ballot score in 42 states through the use of advanced, predictive analytics. In 2018 our predictive analytics tools were a key element of the RNC Voter Scores program and predicted the margins in numerous races with unmatched accuracy.

WPAi has been nationally recognized for providing cutting edge intelligence to help our clients win. The American Association of Political Consultants (AAPC) awarded WPAi “Pollies” for our Predictive Analytics and Adaptive Sampling techniques and our groundbreaking data-focused social media application “Leonardo.” In addition, WPAi received a “Reed Award” for building the most expansive, optimized field program in GOP politics on behalf of Abbott for Governor in 2018.

Learn more about WPAi Digital

School Choice Survey: Oklahoma Council Public Affairs

These findings were originally published on the Oklahoma Council Public Affairs Website

Written by: Brandon Dutcher, Senior Vice President OCPA
The statewide survey of 500 registered Oklahoma voters was commissioned by OCPA and conducted by WPA Intelligence  from January 29 to January 31, 2019. The margin of error is ±4.4 percent.

[imge_br placeholder=”null”]

Yet another scientific survey of Oklahoma voters has found strong support for educational choice.

The statewide survey of 500 registered Oklahoma voters was commissioned by OCPA and conducted by WPA Intelligence from January 29 to January 31, 2019. The margin of error is ±4.4 percent. Below are the questions related to parental choice:

“If you could select any type of school in order to obtain the best education for your child or children, and financial costs and transportation were of no concern, what type of school would you select?”

Traditional public school … 46%
Charter school … 9%
Private or parochial school … 34%
Home school … 7%
Don’t know/refused … 4%

“Now I am going to read you a current educational choice program available for certain demographics in Oklahoma. After I read the program, please indicate if you would support or oppose the program being expanded to include any of the following demographics. The current program makes private-school scholarships available to special-needs students, foster children, and children adopted out of state custody.”

“Do you support or oppose expanding eligibility to children of incarcerated parents?”

Strongly support … 52%
Somewhat support … 24%
TOTAL SUPPORT … 76%

Somewhat oppose … 10%
Strongly oppose … 10%
TOTAL OPPOSE … 20%

Don’t know/refused … 5%

“Do you support or oppose expanding eligibility to homeless students?”

Strongly support … 65%
Somewhat support … 17%
TOTAL SUPPORT … 82%

Somewhat oppose … 6%
Strongly oppose … 8%
TOTAL OPPOSE … 14%

Don’t know/refused … 4%

“A proposal has been made to create an educational choice program in Oklahoma which provides private-school scholarships to public-school students who are bullied or are victims of violence. Would you support or oppose this proposal?”

Strongly support … 45%
Somewhat support … 19%
TOTAL SUPPORT … 64%

Somewhat oppose … 11%
Strongly oppose … 18%
TOTAL OPPOSE … 29%

Don’t know/refused … 6%

“A proposal has been made to enact an individual tax credit for approved educational expenses. Oklahoma parents could receive a state tax credit of up to $2,500 per child for public-school expenses such as costs for band instruments and uniforms, athletic equipment, and other public-school activities. Or, they could receive the tax credit for costs associated with private school tuition or homeschooling. Would you support or oppose this proposal?”

Strongly support … 42%
Somewhat support … 22%
TOTAL SUPPORT … 64%

Somewhat oppose … 11%
Strongly oppose … 17%
TOTAL OPPOSE … 28%

Don’t know/refused … 8%

This survey is the latest among many over the past five years which have measured Oklahomans’ views on parental choice in education. Here is the other survey research that has shown support for various forms of private-school choice:

Braun Research survey (registered Oklahoma voters), January 2014
Tarrance Group survey (registered Oklahoma GOP primary voters), July 2014
SoonerPoll survey (likely Oklahoma voters), January 2015
Tarrance Group survey (registered Oklahoma voters), January 2015
Cole Hargrave Snodgrass and Associates survey (registered Oklahoma voters), December 2015
SoonerPoll survey (likely Oklahoma voters), January 2016
SoonerPoll survey (likely Oklahoma voters), July 2016
Cor Strategies survey (likely Oklahoma voters), August 2017
Cor Strategies survey (likely Oklahoma voters), May 2018
And here is the survey research showing that Oklahomans oppose school vouchers (the survey didn’t ask about tax credits or education savings accounts):

Public Opinion Strategies survey (likely Oklahoma voters), March 2015

Wilson Unpacks Trump’s SOTU with Stephanie Ruhle

Modeling Black Swan Turnout: Just how rare an event were the 2018 mid-terms?

On election night, something amazing happened.

Outside of a few specialists who study such things, America probably hasn’t come to fully understand how remarkable, and rare, this year’s mid-term elections really were.

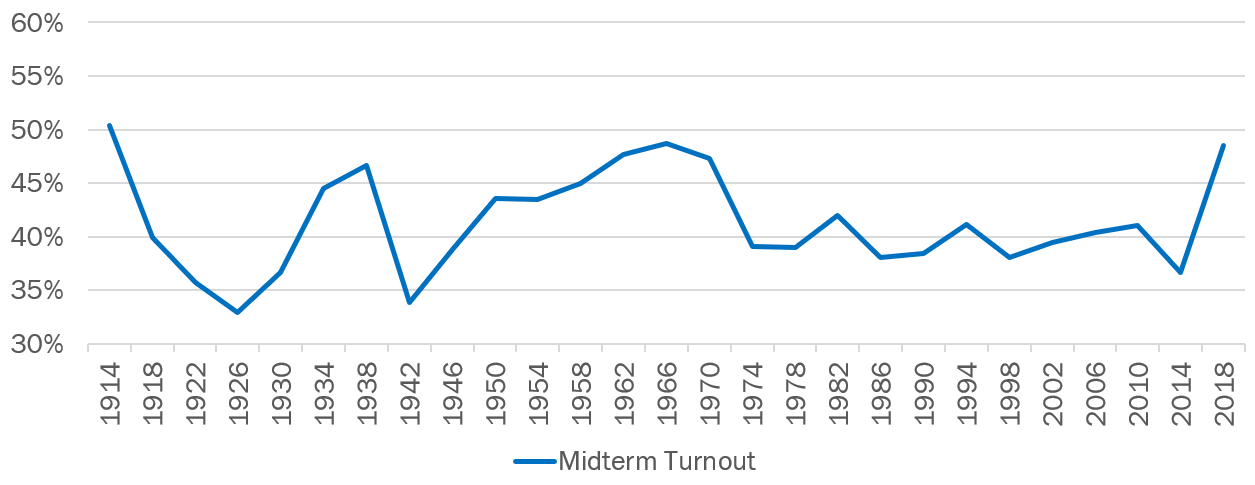
Based on data compiled by the brilliant Michael McDonald at the University of Florida, turnout among voting eligible Americans (that is citizens aged 18+, excluding felons who have not had their voting rights restored) is AT LEAST48.5% with some additional remaining ballots unknown (due to counties not releasing how many uncounted ballots they have — and we’re looking at you Broward County, Florida — as well as states where mail ballots merely need to be post marked by Election Day).

The chart below shows turnout rate for every mid-term since 1914. To put this into historical perspective, we have not seen turnout levels for a midterm this high in more than half a century.

We’re now likely to exceed the 1966 mark. That would clearly be a modern record for mid-term turnout. To find a higher mark, you have to go all the way back to 1914, where turnout was 50.4%. We may not get there, but even if we don’t it means we’ve just had a mid-term election with turnout at levels not reached since the early part of the last century. Quite literally a “100-year flood.”

What’s more, some places exceeded their total turnout from the last Presidential race.

Travis County, Texas, for example, which is by far the most liberal major county in the state and includes the University of Texas, cast at least 25,000 more votes this cycle than it did in 2016. Once all of the votes are tallied, it won’t be the only example of turnout in a mid-term exceeding the previous Presidential race. And that’s almost unheard of.

Why was turnout so high?

We’ll probably need to leave it to years of political science research to fully explain why 2018 was such an outlier compared to not just recent, but also distant, history. But, a few explanations are clear from the start.

This election became a referendum on a first term president in a way few mid-terms have in the past. The opposition party almost always has enthusiasm and turns out a lot of votes, but a massive increase in political tribalism magnified that effect.

On the other hand, the President’s party usually sees its turnout ebb, but this year we saw Republican turnout grow and grow, keeping pace with Democrats’ for the most part. President Trump’s ceaseless campaigning was a big part of that-credit where credit is due.

Both 1966 and 2018 also happened against a background of social unrest and upheaval coupled with strong economies. In 1966, the Vietnam War, Civil Rights, and the social pressures that would explode in the late 60s and early 70s were all at the forefront while the economy was humming along with unemployment down to 4%.

2018, too, came with a roaring economy — 3.7% unemployment on October 1, but with an upsurge in protests, demonstrations, and political violence on both sides.

Technology also likely played a role in the surge in turnout this year as both sides increasingly adopted new modes of political communication, incorporating peer-to-peer texting and internalizing the lessons of political science experiments from the last several years with tools like social pressure for turnout efforts.

As pollsters and political data analysts, the real question we have is what comes next?

Accounting for a Black Swan scenario is always a challenge, in part, because a model that would predict a 1-in-100 outcome is going to be wrong most of the time. But, as we look ahead to the 2020 Presidential election and the 2022 mid-terms, we have to ask ourselves what 2018 and history tell us as a starting point to understanding how coming races may evolve.

Even though we may be headed for a 1914 level of turnout, it’s probably a bad comparison to use. In 1914, turnout had dropped in four of the previous five mid-terms. So, 1914 stands as a record only because turnout fell off of a cliff in 1918 and never really reached late-19th/early 20th Century levels again.

The picture in 1966 might prove more instructive. The graph above shows that mid-term turnout moved up in the 60s, spiked in 1966, then held on for one more midterm before dropping precipitously in the 1970s and not really recovering until this year.

The picture in presidential years is similar — turnout was fairly normal for the period in 1964 and in 1968 (both were between 62% and 63% of the eligible population) before dropping into the 50s in 1972 and not really recovering until 2004. From 2004 to 2016, presidential year turnout has remained fairly stable in the low 60s, with a slight uptick in 2004 and a slight drop in 2012.

The typical mode of modeling turnout is to start from vote history and demography and then move to the instrument for changes in interest, intent to turnout, and other factors. These models perform really well when turnout holds within a “normal” range for its historical period — in other words they’ve been quite good for much of the 21st century, for as long as data and technology have allowed us to build them.

But, they don’t really account for the kind of epochal changes that defined a 1914, a 1966, to some extent a 2004, or now a 2018.

So, for the modeler, the question is how we can understand the broader social and historical context to try to predict whether 2020 and 2022 will continue the surge in turnout? Will they be like the 2004 election which was the first in a series of presidential elections with elevated turnout (though the six-point increase from 2000 to 2004 pales in comparison with the size of the shift that happened this year), or will they be like 1966 — a singular surge that quickly digressed to trending downward.

One approach we will explore is if we can build a fundamentals model that controls for the economy, political polarization, measures of social unrest, and other variables that would fit the macro-shifts over time and then include this macro effect in our individual voter estimates.

What history is telling us is that we’ve just experienced the rarest of rare elections. Off the edge of the map is a scary place to be, but it’s also an exciting opportunity to learn something new about how elections unfold.

More Bad Polling in Texas

Everything is bigger in Texas: from the critters that roam to the size of the barbecue Texans eat. And we can of course add egregious polling errors to the list.

Later this week, Wednesday to be exact, the Texas Lyceum will release polling on the big four races in Texas (Senate, Governor, Lieutenant Governor, and Attorney General).

Let’s take a trip down memory lane to see just how bad this poll has been. Dating back to 2008 the Texas Lyceum has generously given Democrats a massive house effect boost of seven (7!!!) points.

Let’s dig a bit further as to why they give Democrats such a big boost.

Look no further than their samples as they interview 1,000 adults. But, of course, all adults don’t vote. Likely voters do. But Lyceum interviewing adults leads to independents ranging from 12% to 46% (that’s not a typo — yes, forty-six percent). And Democrats varying from twenty-eight percent (28%) to forty-four (44%) percent. Finally, Republicans have ranged from twenty-three (23%) to forty-four (44%) percent. Pretty radical variance no matter how you estimate party ID in the Lone Star State.

Why stress this? Historically, Lyceum toplines offer very little information and most of their data is buried deep within the crosstabs, which they historically don’t release until after they drop the toplines. While they report the party mix of their adult sample, they don’t consistently report the breakdown of the people who actually responded to the ballot until sometimes days later.

Want another Texas sized error? The Texas Lyceum drastically overestimates the share of Hispanic voters in the Lone Star state. This of course has the impact of decreasing the white vote share under 50%.

Even other polls criticized for how they weight each party know that more than half of voters in Texas are white. Even the Democrat biased UT/Texas Tribune poll from June had the white vote share at 58%.

Given recent public polling and the Lyceum house bias, I expect they show the following: Governor Abbott around +12, LG Patrick and AG Paxton both in a dead heat and Senator Cruz around+3. We’ll see if I’m correct, but if I am, as is likey, I could have saved them thousands!

For anyone interested in reviewing Lyceum past surveys, here are convenient links:

April 3–9, 2017
Results
Cross tabs

September 1–11, 2016
Results
Cross tabs

September 8–21, 2015
Results
Cross tabs

September 11–25, 2014
Results
Cross tabs

September 6–20, 2013
Results
Cross tabs

September 10–26, 2012
Results
Cross tabs

May 24–31, 2011
Results
Cross tabs

September 20–30, 2010
Results
Cross tabs

June 5–12, 2009
Results
Cross tabs

June 12–20, 2008
Results
Cross tabs

April 26-May 7, 2007
Results
Multiple cross tabs for 2007:
Number 1
Number 2
Number 3
Number 4
Number 5
Number 6
Number 7