
On election night, something amazing happened.
Outside of a few specialists who study such things, America probably hasn’t come to fully understand how remarkable, and rare, this year’s mid-term elections really were.
Based on data compiled by the brilliant Michael McDonald at the University of Florida, turnout among voting eligible Americans (that is citizens aged 18+, excluding felons who have not had their voting rights restored) is AT LEAST48.5% with some additional remaining ballots unknown (due to counties not releasing how many uncounted ballots they have — and we’re looking at you Broward County, Florida — as well as states where mail ballots merely need to be post marked by Election Day).
The chart below shows turnout rate for every mid-term since 1914. To put this into historical perspective, we have not seen turnout levels for a midterm this high in more than half a century.
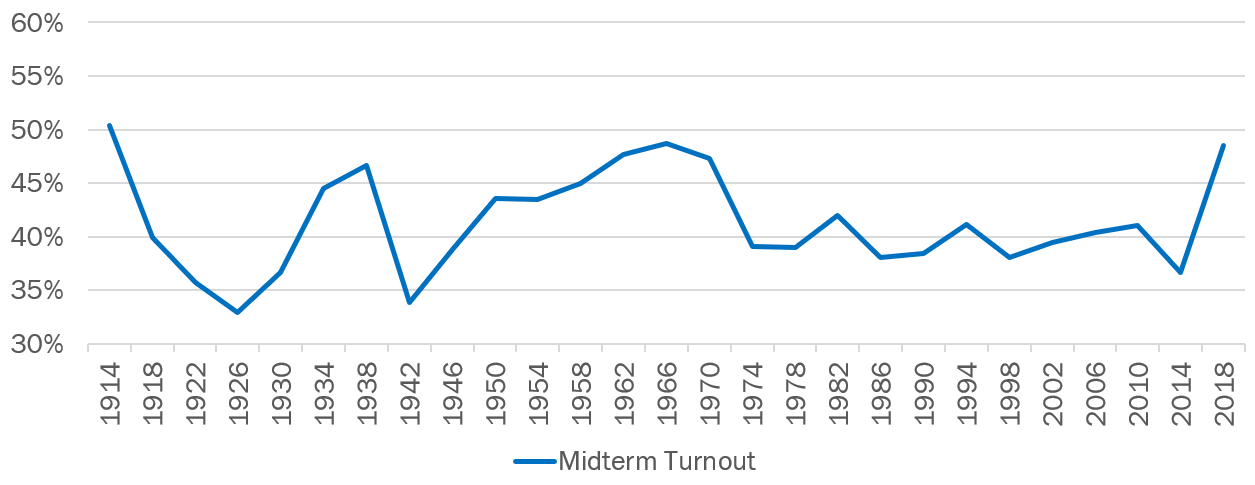
We’re now likely to exceed the 1966 mark. That would clearly be a modern record for mid-term turnout. To find a higher mark, you have to go all the way back to 1914, where turnout was 50.4%. We may not get there, but even if we don’t it means we’ve just had a mid-term election with turnout at levels not reached since the early part of the last century. Quite literally a “100-year flood.”
What’s more, some places exceeded their total turnout from the last Presidential race.
Travis County, Texas, for example, which is by far the most liberal major county in the state and includes the University of Texas, cast at least 25,000 more votes this cycle than it did in 2016. Once all of the votes are tallied, it won’t be the only example of turnout in a mid-term exceeding the previous Presidential race. And that’s almost unheard of.
Why was turnout so high?
We’ll probably need to leave it to years of political science research to fully explain why 2018 was such an outlier compared to not just recent, but also distant, history. But, a few explanations are clear from the start.
This election became a referendum on a first term president in a way few mid-terms have in the past. The opposition party almost always has enthusiasm and turns out a lot of votes, but a massive increase in political tribalism magnified that effect.
On the other hand, the President’s party usually sees its turnout ebb, but this year we saw Republican turnout grow and grow, keeping pace with Democrats’ for the most part. President Trump’s ceaseless campaigning was a big part of that-credit where credit is due.
Both 1966 and 2018 also happened against a background of social unrest and upheaval coupled with strong economies. In 1966, the Vietnam War, Civil Rights, and the social pressures that would explode in the late 60s and early 70s were all at the forefront while the economy was humming along with unemployment down to 4%.
2018, too, came with a roaring economy — 3.7% unemployment on October 1, but with an upsurge in protests, demonstrations, and political violence on both sides.
Technology also likely played a role in the surge in turnout this year as both sides increasingly adopted new modes of political communication, incorporating peer-to-peer texting and internalizing the lessons of political science experiments from the last several years with tools like social pressure for turnout efforts.
As pollsters and political data analysts, the real question we have is what comes next?
Accounting for a Black Swan scenario is always a challenge, in part, because a model that would predict a 1-in-100 outcome is going to be wrong most of the time. But, as we look ahead to the 2020 Presidential election and the 2022 mid-terms, we have to ask ourselves what 2018 and history tell us as a starting point to understanding how coming races may evolve.
Even though we may be headed for a 1914 level of turnout, it’s probably a bad comparison to use. In 1914, turnout had dropped in four of the previous five mid-terms. So, 1914 stands as a record only because turnout fell off of a cliff in 1918 and never really reached late-19th/early 20th Century levels again.
The picture in 1966 might prove more instructive. The graph above shows that mid-term turnout moved up in the 60s, spiked in 1966, then held on for one more midterm before dropping precipitously in the 1970s and not really recovering until this year.
The picture in presidential years is similar — turnout was fairly normal for the period in 1964 and in 1968 (both were between 62% and 63% of the eligible population) before dropping into the 50s in 1972 and not really recovering until 2004. From 2004 to 2016, presidential year turnout has remained fairly stable in the low 60s, with a slight uptick in 2004 and a slight drop in 2012.
The typical mode of modeling turnout is to start from vote history and demography and then move to the instrument for changes in interest, intent to turnout, and other factors. These models perform really well when turnout holds within a “normal” range for its historical period — in other words they’ve been quite good for much of the 21st century, for as long as data and technology have allowed us to build them.
But, they don’t really account for the kind of epochal changes that defined a 1914, a 1966, to some extent a 2004, or now a 2018.
So, for the modeler, the question is how we can understand the broader social and historical context to try to predict whether 2020 and 2022 will continue the surge in turnout? Will they be like the 2004 election which was the first in a series of presidential elections with elevated turnout (though the six-point increase from 2000 to 2004 pales in comparison with the size of the shift that happened this year), or will they be like 1966 — a singular surge that quickly digressed to trending downward.
One approach we will explore is if we can build a fundamentals model that controls for the economy, political polarization, measures of social unrest, and other variables that would fit the macro-shifts over time and then include this macro effect in our individual voter estimates.
What history is telling us is that we’ve just experienced the rarest of rare elections. Off the edge of the map is a scary place to be, but it’s also an exciting opportunity to learn something new about how elections unfold.